
One of the long-standing problems with city planning is how to translate large area proposals with land use, zoning ordinance adjustments, economic concerns, and population requirements with localized visuals of site-specific scenarios. Planners experience this burden as city projects, divergent views on plans, site aesthetics, and public sentiment are all difficult to translate into one coherent picture – specifically a closer-to-reality 3D picture that makes long-term changes to the city-scape understandable and accessible to everyone. As successful, growing cities experience the influx of residents, businesses, and environmental change, the need for faster, more reliable, and accurate visualization and analysis tools become a necessity.
Our actions are increasingly connected. In our communities, our housing investments affect how and where we travel. Our policies impact our housing choices. Our neighborhoods determine where we shop. Zoning adjustments bring in new businesses and opportunities. New businesses alter the economic and demographic condition of a community. How can we visualize the ways in which disparate decisions interact in a real-world setting? Many communities engage in visioning exercises to set the stage for many of these decisions. Community visioning exercises, increasingly, use a technique called scenario planning. This approach analyzes known trends in resident / community interactions to accurately estimate the outcome of potential scenarios. These scenarios are a way to visualize the future cityscape, economic trajectory, and social fabric of a community.
Effective scenario planning requires software platforms that combine data sets, presenting analysis in a 3D format, and works from a web browser for ease of use. While long-range planning integrates scenario planning into its process, there are few software platforms capable of effective scenario planning that offer the benefits of relative-scale, interactive 3D visualizations. ArcGIS Urban is one of the few available platforms today that offer such an experience combining multiple data sources operational for anyone with internet connectivity.
How does all this work?
Let’s walk through industry’s leading most scenario planning tool ArcGIS Urban, as applied to a real-world scenario planning process in Littleton, Colorado. Littleton is a suburb of the greater Denver metropolitan area and, like many suburbs of growing cities, is experiencing growth that requires sustainable planning to continue and maintain. Plan amendments, zoning ordinances, built-environment parameters, demographic and economic predictions, and site plans were difficult to discuss and understand between stakeholders and many divergent views. Littleton officials and planners knew that embracing the power of ArcGIS Urban could help place all these variables into a single digital platform. The web-based, interactive, 3D capable planning tool was combined with economic sensitivity metrics to form a central planning hub for the 4-year long planning process. ArcGIS Urban allowed Littleton to see the full puzzle.
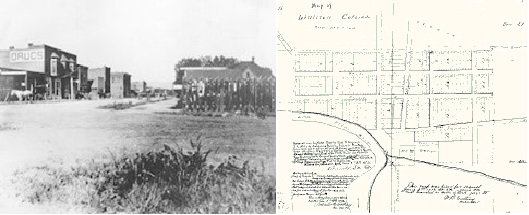
The citizens and stakeholder’s vision to maintain a small town character while promoting more growth found its roots dating back to the city’s founding as a village in the late 1870s. It is a collection of grid streets and one-two-story buildings. The citizens of Littleton has long enjoyed the historical small town charm but the recent growth pressure is creating demand for an increase in the intensity of redevelopment downtown. In the last few years, two dozen applications were submitted to redevelop downtown parcels which is inevitably putting a lot of pressure to the leadership to maintain its historical significance.
What will this development look like? Will it degrade or compliment the historic downtown appeal? What new opportunities arise from land use changes? The city turned to the duo enCodePlus and ViewPro to deploy the ArcGIS Urban platform as a scenario planning tool for both residents, Planners and stakeholders to make educated decisions. It combined a 3D visualization of possible built forms, building scale, and land use from zoning adjustments with economic and demographic indicators. Planners are now able to change zoning designations, FAR, setbacks, and other site-specific regulations to spur productive conversation and validate various concepts and ideas. The city’s future vision can now be experienced in a closer-to-reality perspective of existing proposals and their long-term physical, social, and economic consequences, bridging the ideas of many with the reality on the ground.
https://www.littletongov.org/my-littleton/littleton-history/general-history

https://www.pinterest.com/pin/516647388474791827/
https://www.uncovercolorado.com/best-neighborhoods-in-littleton-co/
ArcGIS Urban allowed the city to present multiple scenarios more widely than traditional public meetings. Addressing concerns in certain areas of Littleton became easier as the public and planners are on the same page, see the same data, and have the same results explorable in this modern, high-tech, and accessible web tool. In downtown, parking, walkability, infill, and redevelopment are its biggest issues or unknowns. Urban allows the city to visualize ‘what if’ scenarios to address its challenges:
- - Understand changes to physical character and form
- - Engage residents to gauge sensitivities to physical and economic shifts
- - Assessing alternative building types and forms
- - Rendering massing for understanding scale and viewshed
- - Analyze and identify acceptable and preferred scenarios in 3D
- - Evaluate economic feasibility and viability of potential land use designations
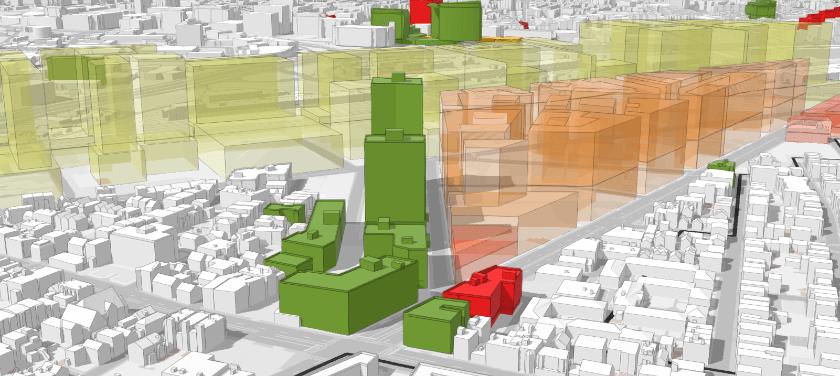
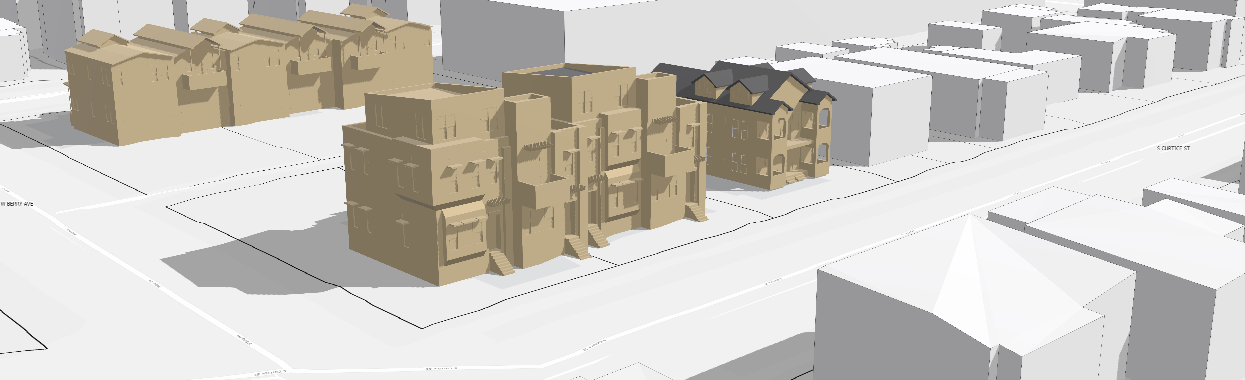
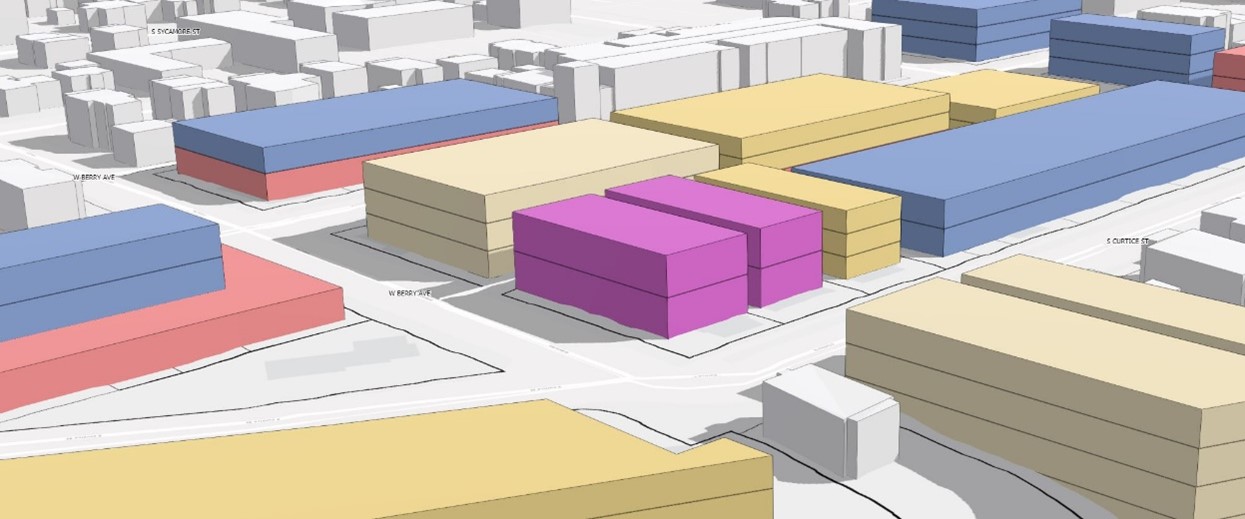
For example, most of downtown has a low floor-area ratio. ArcGIS Urban allowed for a buildable land analysis as part of the scenario planning process. Increasing this ratio through infill development can look like this:
Based on the existing applications, though, Urban tells us that the vision will actually look like this in reality. The differences between existing, the ideal, and potential results are all on display.
How Does ArcGIS Urban Do This?
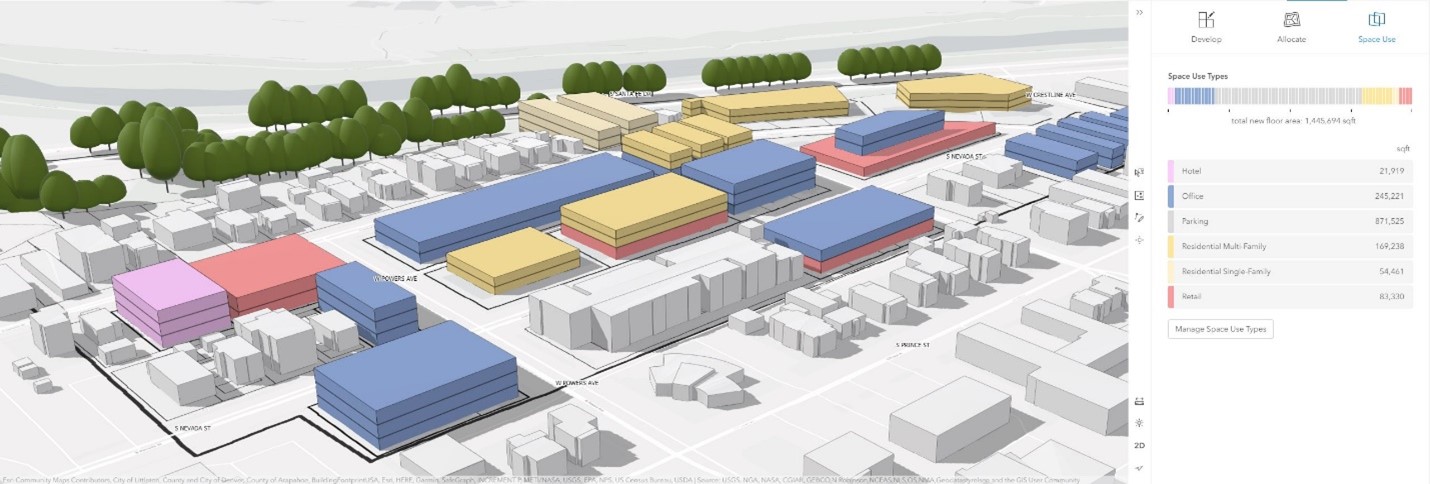
ArcGIS Urban encompasses elements across the ESRI platform. It starts with data and creating as many 3D data packages as possible. Unfortunately, most of the data available is in 2D. This format is workable however 3D data supports better visualizations, analysis, and responsiveness. Its inherent 3D capabilities help both planners and the decision-makers benefit from the 3D interaction of the tool.
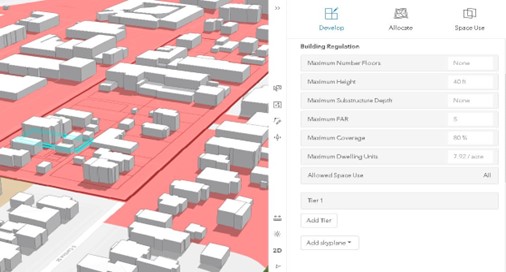
ArcGIS Urban uses existing data on buildings, lots, and zoning code to create a 3D model of your city or planning area. Data such as building heights, floor counts, building setbacks, allowable uses, and parcel shape can all be manipulated by planners and the public to create different scenarios on the fly. A model lets you see various projects, plans, data indicators, and community-submitted ideas, further increasing the city’s inclusivity and accountability to important long-term changes.
Critically, ArcGIS Urban lets practitioners pull outputs into ArcGIS Pro and City Engine. This facilitates more sophisticated, in-house analysis. With each new iteration of Urban, more and more capabilities are added.
Data availability informs the specific types of analysis that are feasible. Municipalities can add their development regulations into the platform or pull textualized regulation (e.g. enCodePlus) into the database. This allows for more than just scenario planning. Local governments can conduct design reviews, zoning updates, and buildable land analysis like in downtown Littleton. This is especially quick and effective as ArcGIS Urban works seamlessly with existing Esri databases and workflows that most city planning departments already have in place.
In our next blog post, we will demonstrate the ArcGIS Urban platform was extended with City of Littleton to measure and incorporate economic sensitivity that ensures economically sustainable development that can withstand major economic ups and downs.


